Draw a Multi-series Donut
- Load the API into the page you would like your diagram using
<php tripald3_load_libraries();?> - Retrieve you data and manipulate it into the structure required by the chart. This can be done a number of ways, the easiest of which is to query your database in your Drupal preprocess hook and then save the results as a javascript setting.
/**
* Preprocess hook for template my_example.tpl.php
* The module name is demo.
*/
function demo_my_example_preprocess(&$variables) {
// Load the API (Step #1 above)
tripald3_load_libraries();
// Retrieve your data.
// For this example we're just going to define the array directly.
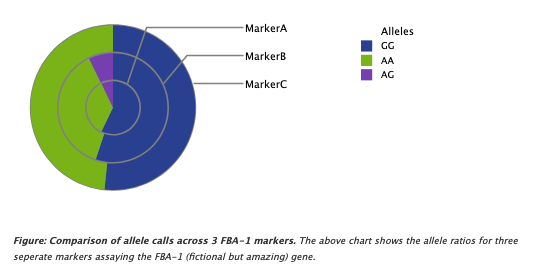
$multiDonutData = [
[
"label": "MarkerA",
"parts": [
[
"label": "GG",
"count": 16,
],
[
"label": "AA",
"count": 10,
],
[
"label": "AG",
"count": 2,
],
],
],
[
"label": "MarkerB",
"parts": [
[
"label": "GG",
"count": 145,
],
[
"label": "AA",
"count": 99,
],
[
"label": "AG",
"count": 19,
],
],
],
[
"label": "MarkerC",
"parts": [
[
"label": "GG",
"count": 78,
],
[
"label": "AA",
"count": 73,
],
],
],
];
// Make it available to javascript via settings.
$settings = array(
// Always namespace to your module to avoid collisions.
'demo' => array(
// Pass in your data using a descriptive settings key.
'stockTypeDonutData' => $multiDonutData,
),
);
drupal_add_js($settings, 'setting');
}
- Add a container element in your template where you would like the chart drawn.
<div id="tripald3-multidonut" class="tripald3-diagram">
  <!-- Javascript will add the Multi-series Donut Chart, Title and Figure legend here -->
</div>
- Draw the chart in your template by calling tripalD3.drawChart(). This is done within a script tag using Drupal behaviours to ensure it is run at the correct point and the data prepared is passed in.
<script type="text/javascript">
  Drupal.behaviors.tripalD3demoSimpleDonut = {
    attach: function (context, settings) {

      // Pull the data out of the javascript settings.
      var data = Drupal.settings.demo.stockTypeDonutData;

      // Draw your chart.
      tripalD3.drawFigure(
        multiDonutData,
        {
          "chartType" : "multidonut",
          "elementId": "tripald3-multidonut",
          "height": 250,
          "width": 650,
          "keyPosition": "right",
          "title": "Comparison of allele calls across 3 FBA-1 markers",
          "legend": "The above chart shows the allele ratios for three seperate markers assaying the FBA-1 (fictional but amazing) gene.",
          "key": {"title": "Alleles"},
        }
      );
    }
  };
</script>
- There is no step #5; you’re done!